
'Excess savings', household debt and spending
A cross-country analysis

I have long used Twitter to post what I hope are interesting and thought-provoking charts on the Aussie and kiwi economies, markets and central bank musings (plus cross-country colour).
This is my first post here. Hope you like it.
The unstoppable US consumer
The recovery in consumer spending since the heights of the pandemic has been very different across economies.
Real consumer spending by UK households, for example, remains below pre-COVID levels. It has also been relatively weak in the euro area, Japan and Canada.
In contrast, the recovery in spending has been more robust in the US, New Zealand and Australia. (Part of the strength in the Antipodes, however, reflects strong population growth.) The outperformance of the US consumer is even starker when focusing just on the retail sector.
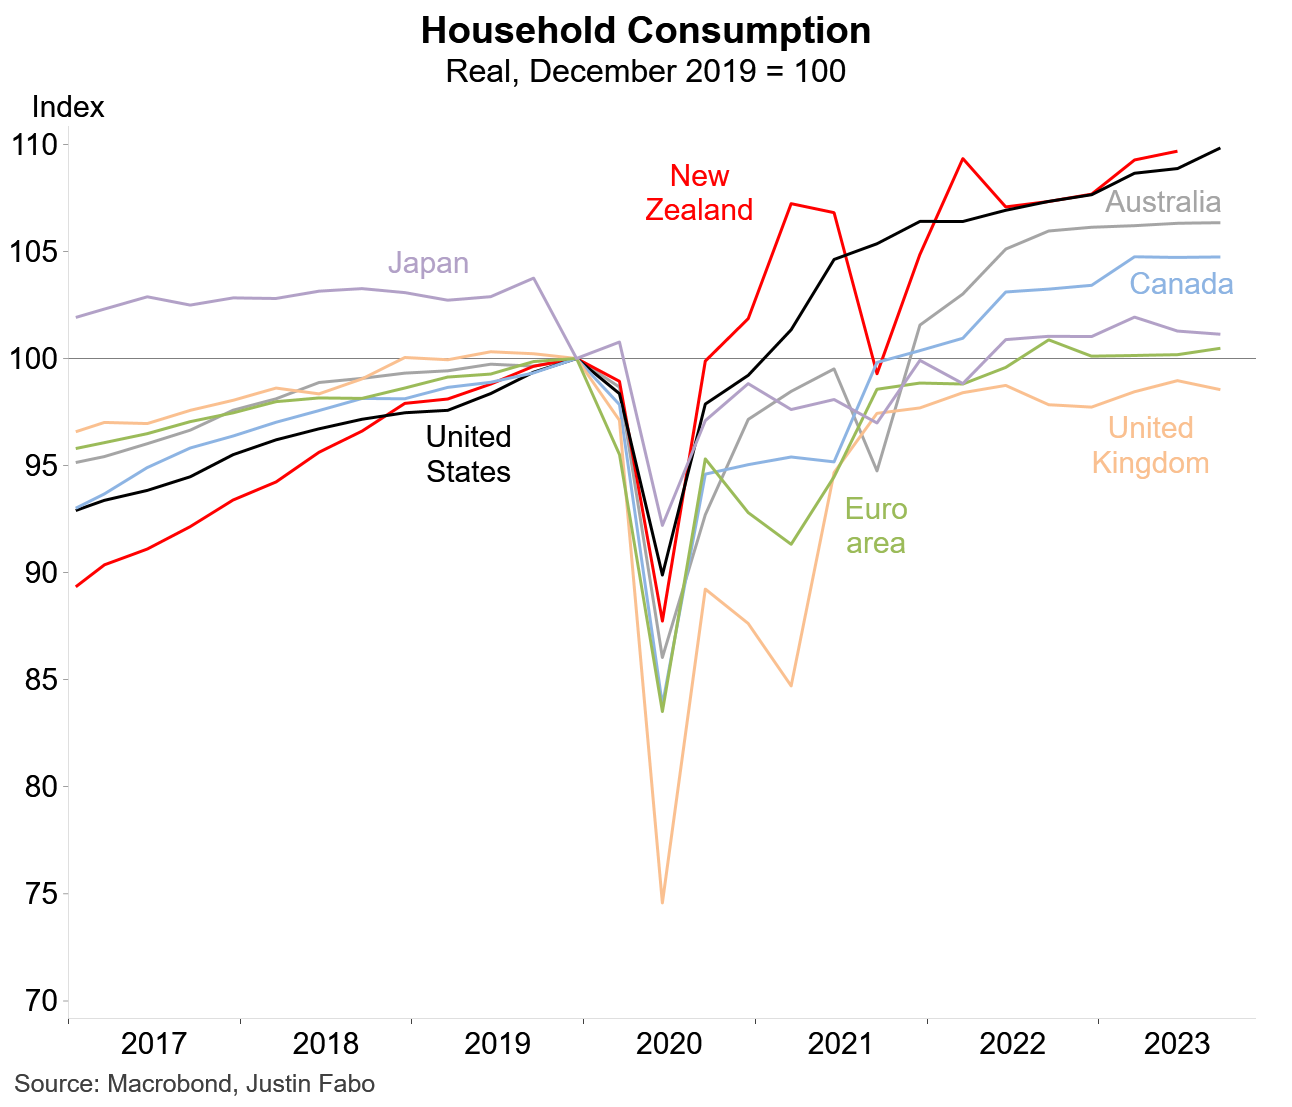

The resilience of recent growth in US consumption also stands out when compared with pre-COVID averages. On this basis, real consumption growth over the past year has been weak, to very weak, across the Antipodes, Europe and Canada.

Why has the US consumer been so much more resilient?
It’s not because US households have enjoyed significantly better income growth than elsewhere. Real household disposable income growth in the US has been middle of the pack, though it is now benefiting from a sharper decline in inflation than in peer economies.
It is clear, however, that persistent weakness in real incomes in Europe (amid very high inflation) have been an important factor weighing on consumer spending.

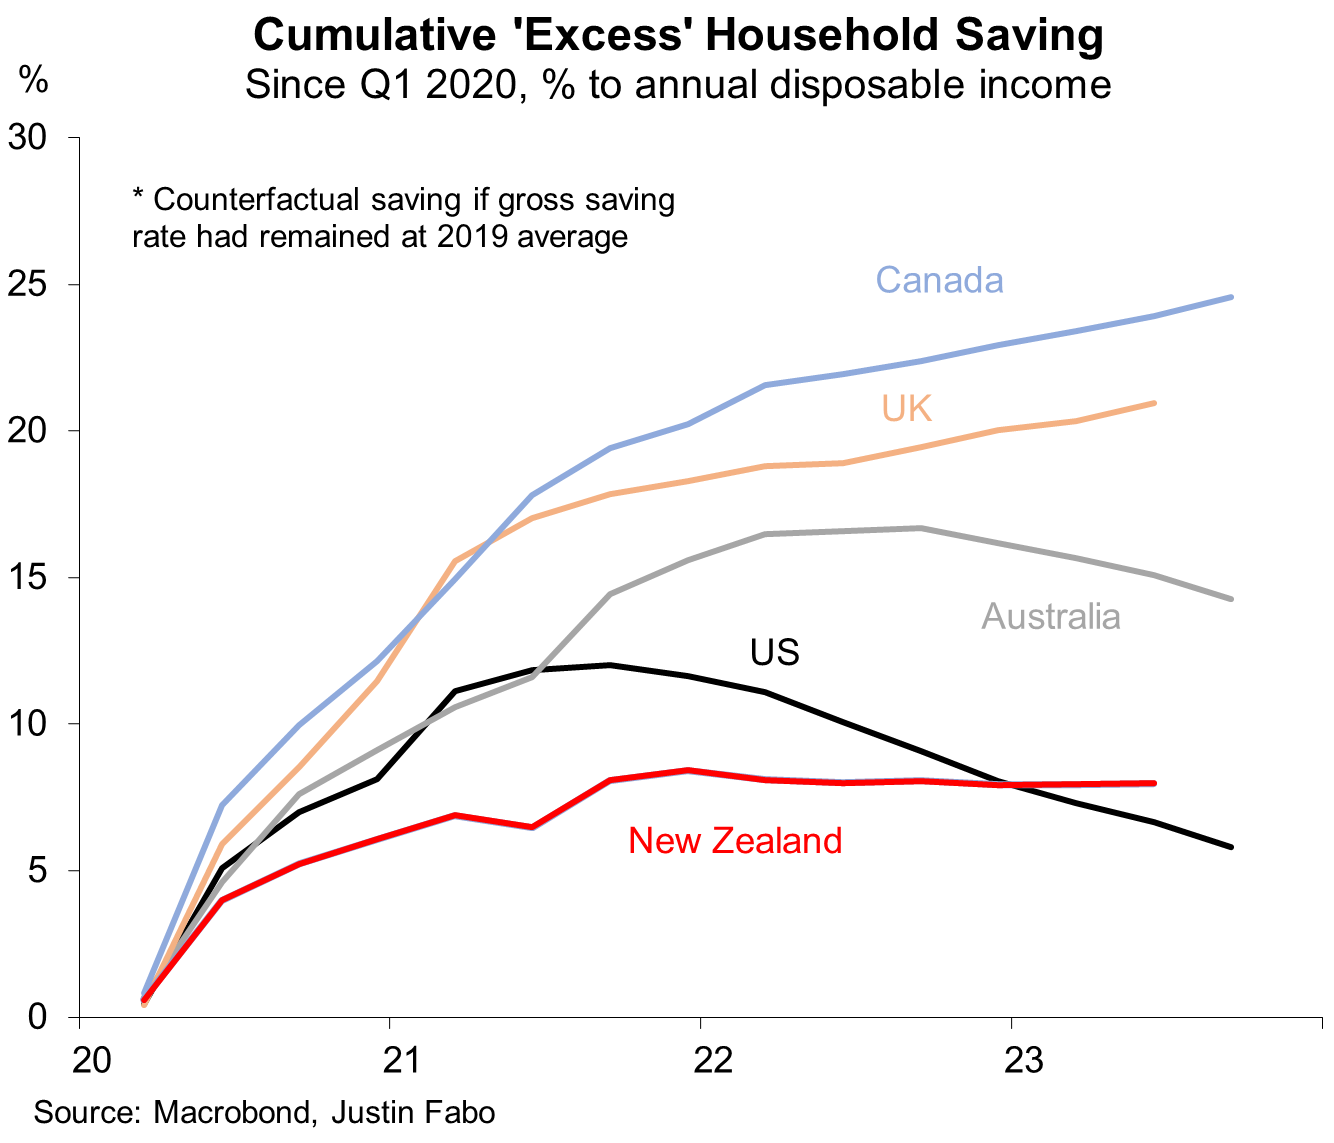
US households also did not accumulate ‘excess’ savings during the pandemic to the same degree as in some other economies, notably Canada, the UK and Australia.1
But US households have collectively been drawing upon those ‘excess’ savings to support spending. This has not been the case elsewhere (at least until recently in Australia).
Why? The relatively lower debt burden of US households has arguably provided more scope for ‘excess’ savings to be spent.

In contrast, households in economies with high household debt burdens - Australia, New Zealand and Canada - are likely to have been more inclined to use ‘excess’ savings to shore up balance sheets and cushion the impact of higher interest rates.
The combination of lower indebtedness and the largely fixed-rate nature of mortgages in the US is providing a significant degree of ‘protection’ for US households from higher interest rates.
The average interest rate on outstanding mortgages has risen only modestly in the US and in stark contrast to elsewhere. (Sharply higher mortgage rates on new housing loans, however, will continue to weigh heavily on housing construction and existing home turnover.)

Putting all that together, it’s no huge surprise that US consumer spending has been fairly robust in recent years.
But maintaining relatively strong growth will become more difficult.
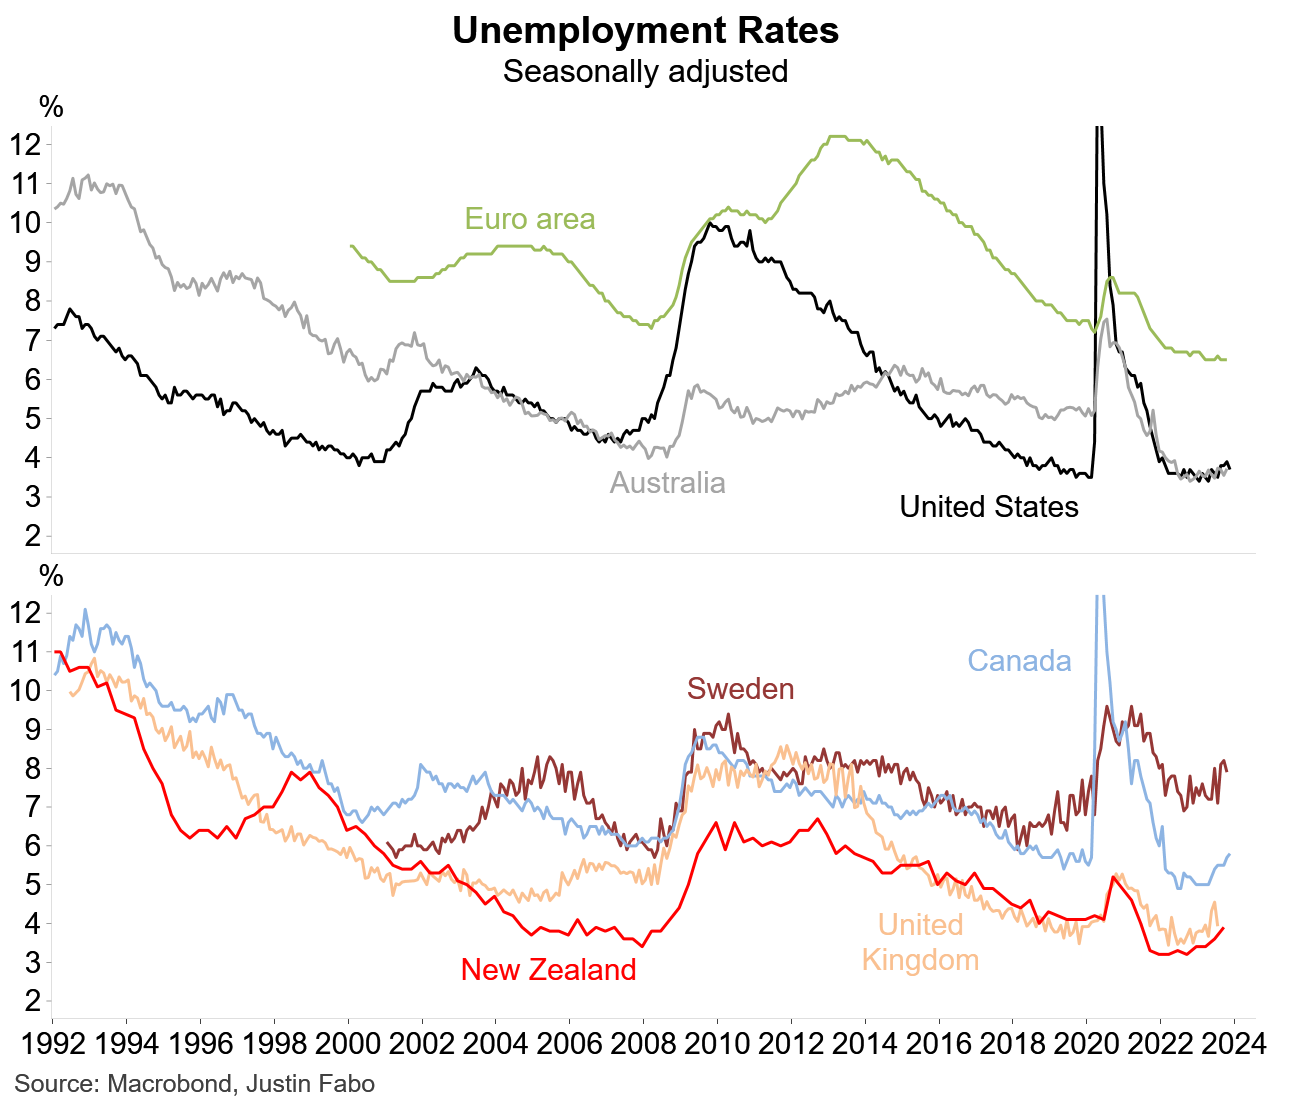
While the prospect of further disinflation will support real income growth, the scope for US households to draw upon ‘excess’ savings is diminishing. Further, the likelihood of rising unemployment will further take the edge off spending. While unemployment remains very low in most economies, it has already been drifting higher in some.
There are different ways to measure ‘excess’ savings, but they yield broadly similar results. I keep it simple and transparent. ‘Excess’ saving is measured as the additional gross saving that has occurred since early 2020 over and above what would have occurred if the gross saving ratio had remained at the 2019 average.
Great analysis Justin! It's interesting that the unemployment spikes in the EU, UK and NZ were relatively modest during COVID. EU outcome is presumably due mostly to their labour laws but I wouldn't think that was the situation for NZ and the UK? Do you happen to know what employment support schemes those countries used? Direct subsides? Tax incentives? It would be interesting to learn why the responses by employers were much less aggressive. That would make for a very interesting comparison and potentially useful for policy makers in every country.
Great post. It looks to me that spending growth by country really kept the same patterns and differences by country that had before the pandemic, pointing at more structural causes within those economies, eg demographics, taxation, labour market, gdp growth.
If you did the same charts starting at 100 in 2017, we may see a long term pattern as opposed to a divergence post covid. What do you think?