2. Taking a longer run view, the saving ratio in Australia has remained noticeably higher than in the UK, US and Canada since the mid-2000s.
3. New Zealand’s household debt-to-income ratio declined further in Q4 2023.
4. Mortgage repayment affordability remains very stretched for new buyers of the median priced home in New Zealand.
5. The wages share of income in New Zealand rose further in Q4 2023 to the highest level since the late 1980s.
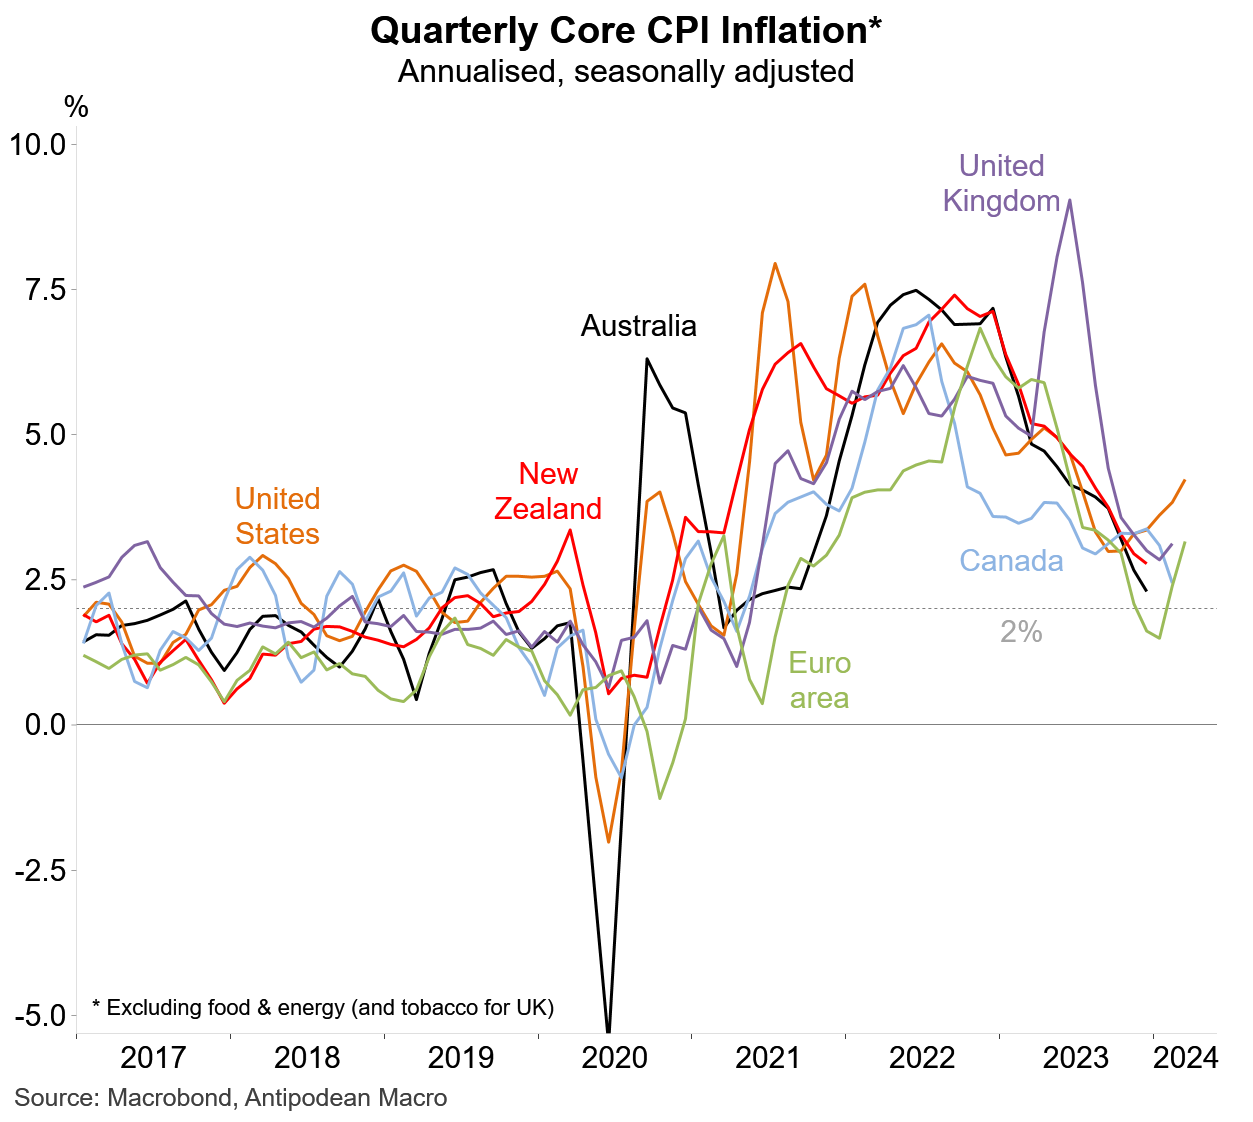
6. US CPI inflation for March freaked markets out by printing on the high side again. Trimmed mean inflation was running ~4% on an annualised basis in Q1.
Excluding food and energy, US inflation is now the outlier…not in a good way.
7. The only consolation in the US CPI report was that the breadth of inflation dipped back to average rates (we focus on the share of the CPI basket with annualised monthly inflation above 2.5% as that is broadly consistent with the Fed’s 2% PCE inflation target).
8. This is the US inflation chart that will be freaking out central bankers around the world. Services inflation has picked up again sharply.
9. On a comparable basis, the strengthening in US services inflation is a warning shot for the RBA…
10. …particularly when growth in unit labour costs has been relatively moderate in the United States.
11. A question now is does underlying inflation in Australia (and Canada) follow the US higher?
Note that our Q1 trimmed mean CPI inflation estimate for Australia is a strong +0.95% q/q. See link below for more…
12. Aussie household inflation expectations ticked higher in April but remained much lower than 12-18 months ago.
Discussion about this post
No posts


