
ONLY CHARTS #581
Aus average hours worked, Aus Labour Account, Aus consumer confidence & petrol prices, US labour productivity & ULCs, Global shipping costs, South Australia Budget, AI terms in job ads

ONLY CHARTS is now only available to paid subscribers.
A 7-day free trial is available below. Group discounts are available here.
Antipodean Macro’s in-depth research is available here.
1. Remember that big spike in average hours worked in the Aussie labour force survey in April? At the time, we suggested it was largely related to the timing of the Easter holidays.
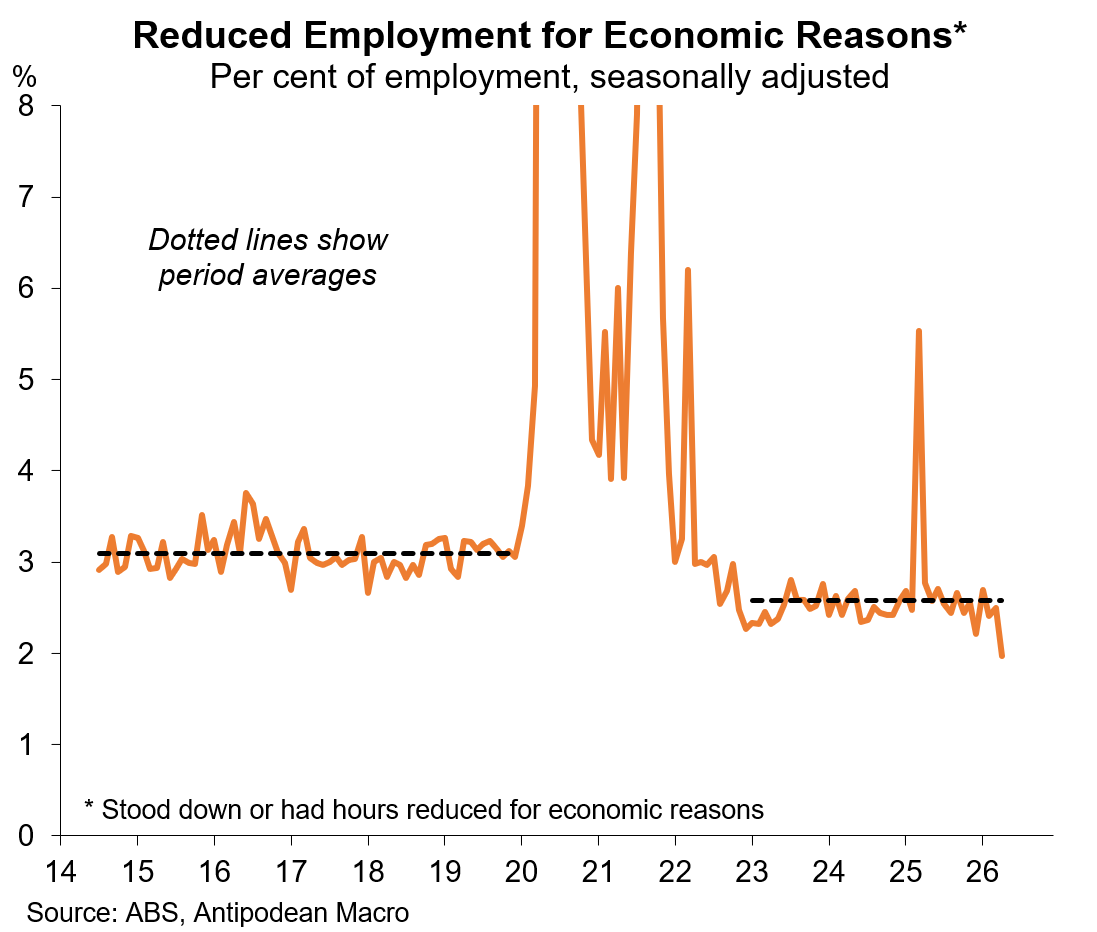
Detailed data also showed a sharp fall in the share of Australian workers on reduced hours for economic reasons in April. That looks like an anomaly and we expect a bounce back in May (and fall in average hours worked).
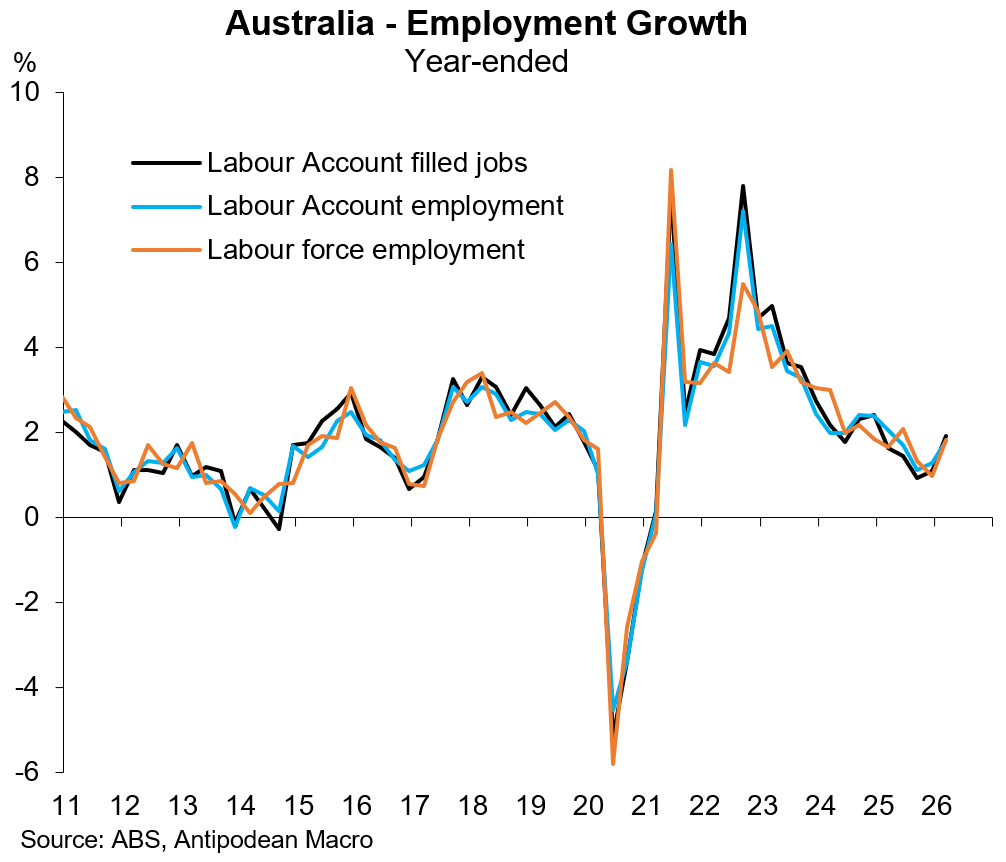
2. According to the Labour Account, the number of filled jobs in Australia rose +0.6% q/q and +1.9% y/y in Q1. The number of main and secondary jobs both grew +0.6% q/q.
The number of employed persons (+0.7% q/q) and hours worked (+0.9% q/q) both increased in Q1.
3. The number of non-market sector - health, education & public administration - filled jobs in Australia increased +0.6% q/q and +2.1% y/y in Q1. Market-sector filled jobs rose +0.6% q/q and +1.8% y/y.
Hours worked rose faster in Australia’s market sector than the non-market sector in the quarter (+1% vs +0.5%) and over the year (+2.4% vs +1.9%).
Keep reading with a 7-day free trial
Subscribe to Antipodean Macro to keep reading this post and get 7 days of free access to the full post archives.