ONLY CHARTS #281
Aus market/non-market employment, Aus industry labour productivity, Aus multiple jobholders, Aus consumer spending
ONLY CHARTS is now only available to paid subscribers.
A 7-day free trial is available below. Group discounts are available here.
Antipodean Macro’s in-depth research is available here.
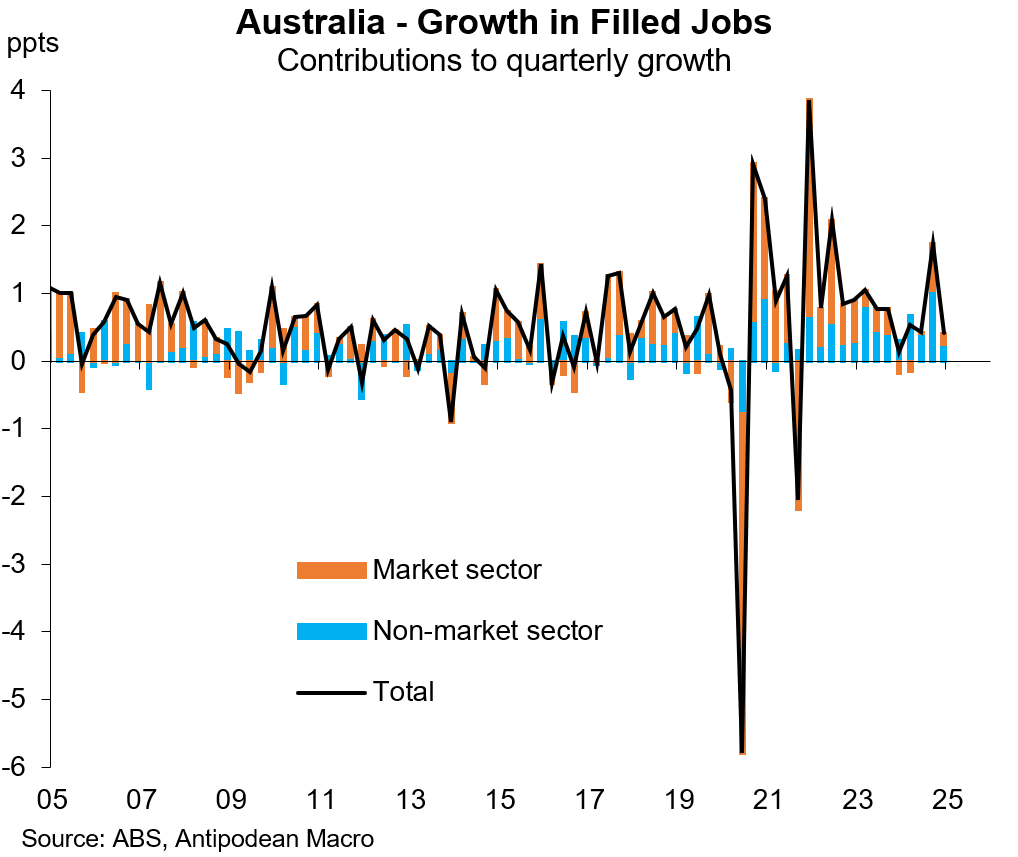
1. According to the Labour Account, the number of filled jobs in Australia rose just +0.4% q/q in Q4, though this followed a +1.7% q/q increase in Q3.
Employment and hours worked both rose +0.7% q/q in Q4. The slower growth in filled jobs was because the share of multiple job holders increased (see below).
The non-market sector continued to contribute more than half of total jobs growth, but market sector jobs growth picked up over H2 2024.
Since Q1 2018, the non-market sector has contributed more to jobs growth than the market sector despite still accounting for just 30% of total jobs in Australia (at the start of 2018 the share was less than 26%).
2. Over the year, the large health care & social assistance industry contributed around half of total jobs growth in Australia.
Keep reading with a 7-day free trial
Subscribe to Antipodean Macro to keep reading this post and get 7 days of free access to the full post archives.


