1. Australia’s GDP rose +0.24% q/q and 1.5% y/y in Q4 2023, which was in line with consensus and the RBA’s +1.5% y/y SoMP forecast.
2. Real GDP per capita has fallen for 3 quarters in Australia but it’s not alone in exhibiting weakness.
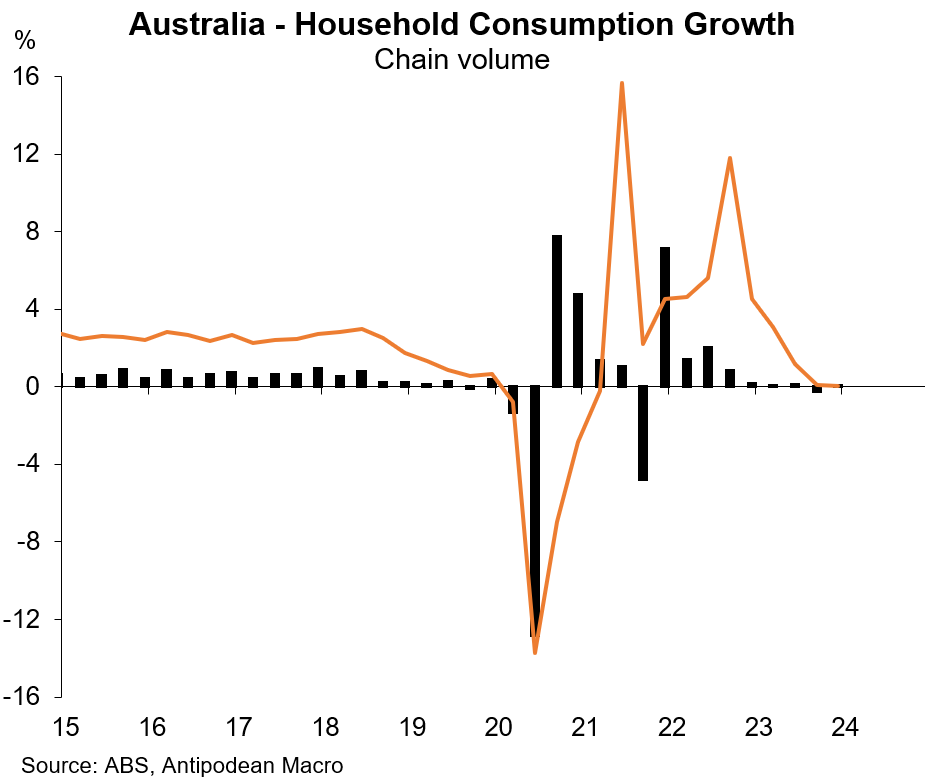
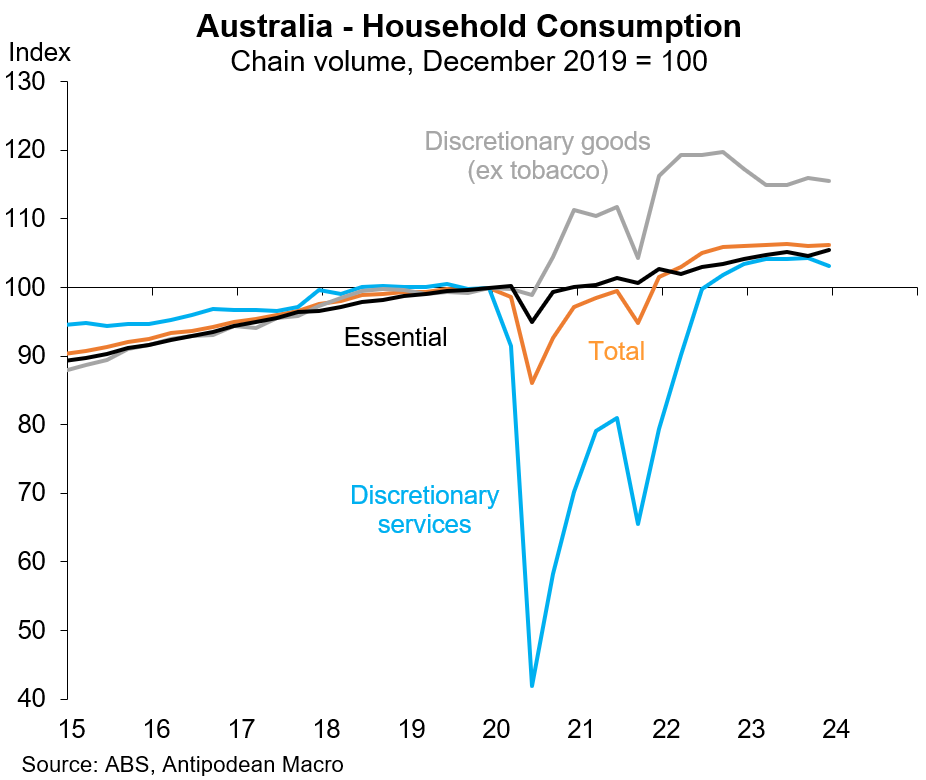
3. Household consumption in Australia rose just +0.1% in Q4 2023 and over the year. Real discretionary spending declined in the quarter.
Aggregate consumer demand in Australia - including net international travel spending - has looked a little healthier than just domestic consumption.
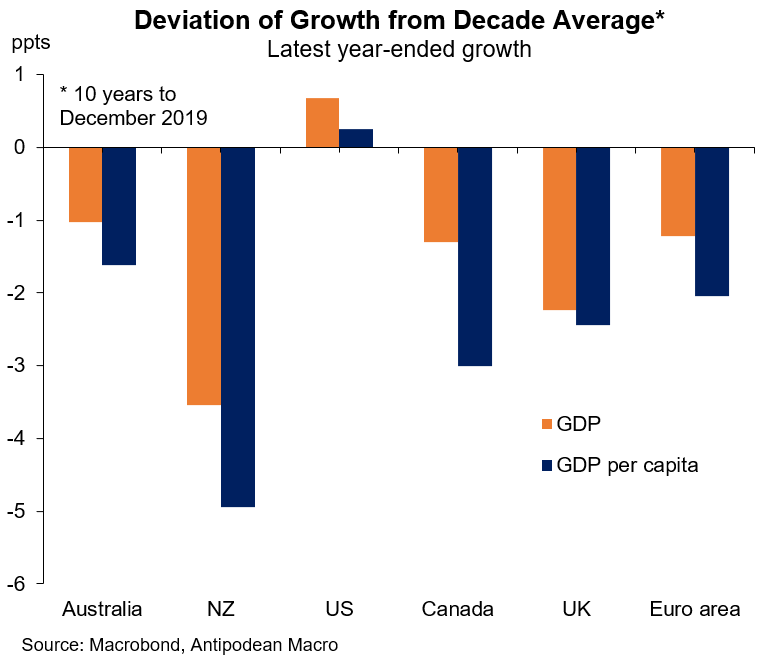
Consumption growth in Australia and New Zealand has been very weak relative to the decade average.
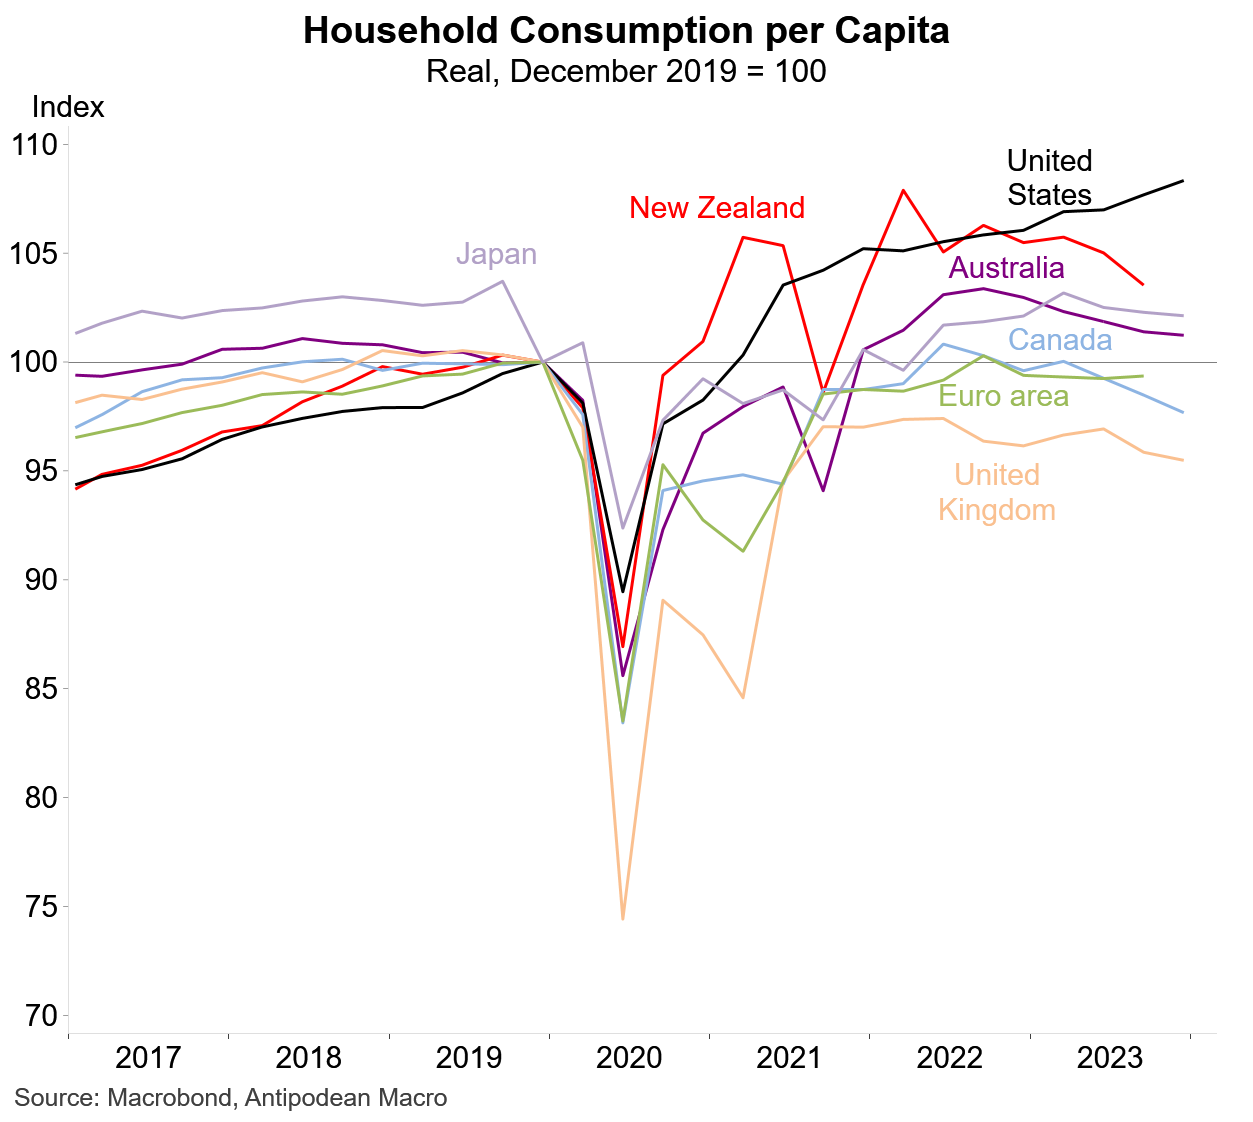
4. Real consumption per capita has been weak everywhere but the United States
5. The net household saving ratio in Australia rose to 3.2% in Q4. Australia’s gross household saving ratio also increased, though the stock of ‘excess’ household saving since the pandemic declined a little as a share of disposable income.
6. That occurred alongside growth in nominal household disposable income of +2.3% q/q and +5% y/y - in real terms it rose +1.5% q/q and just +0.3% y/y.
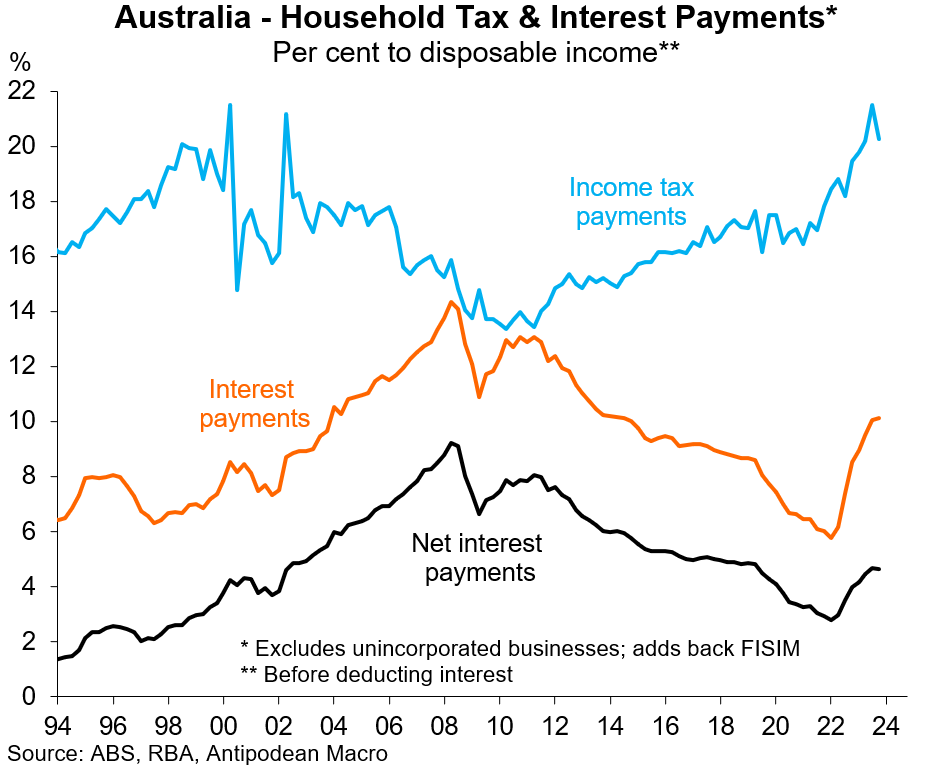
7. Household disposable income growth was supported in Q4 by lower income tax payments (as foreshadowed by monthly tax data) in Q4 2023 and net interest payments also ticked lower as a share of disposable income.
8. Labour productivity - GDP per hour - rose again in Australia in Q4…
…but that was mostly driven by a decline in hours worked in the quarter
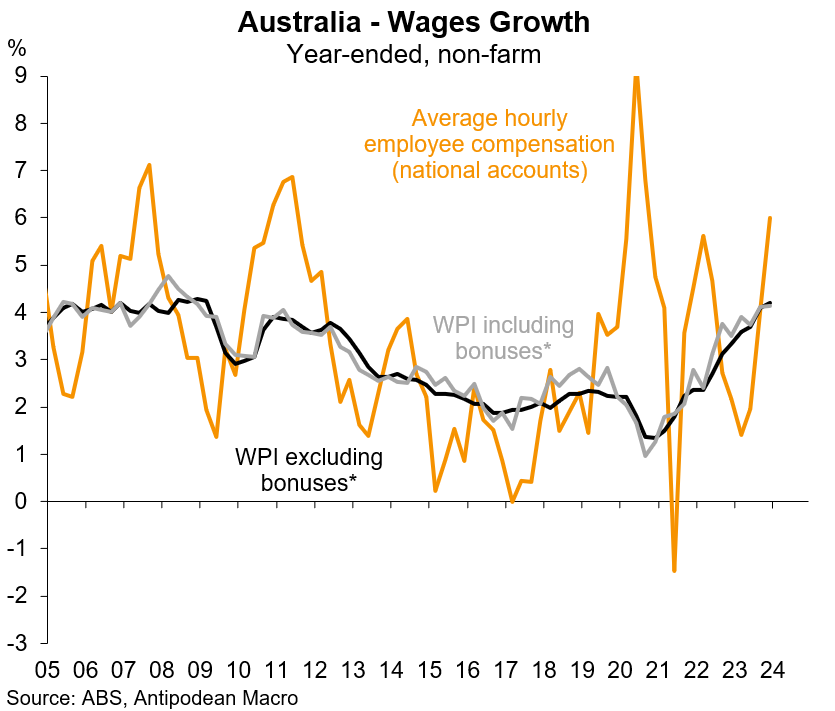
9. The fall in hours worked also resulted in a +1.5% q/q and +6% y/y rise in average hourly earnings of non-farm employees in Q4.
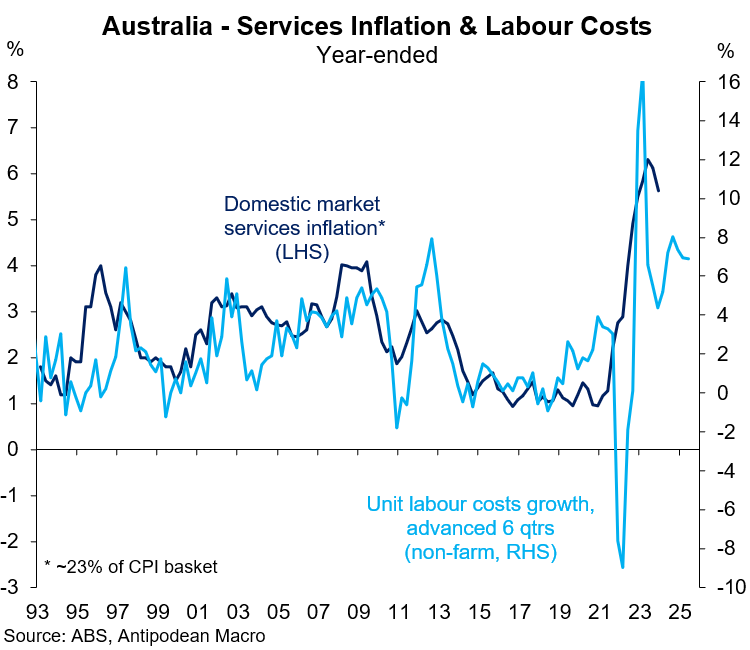
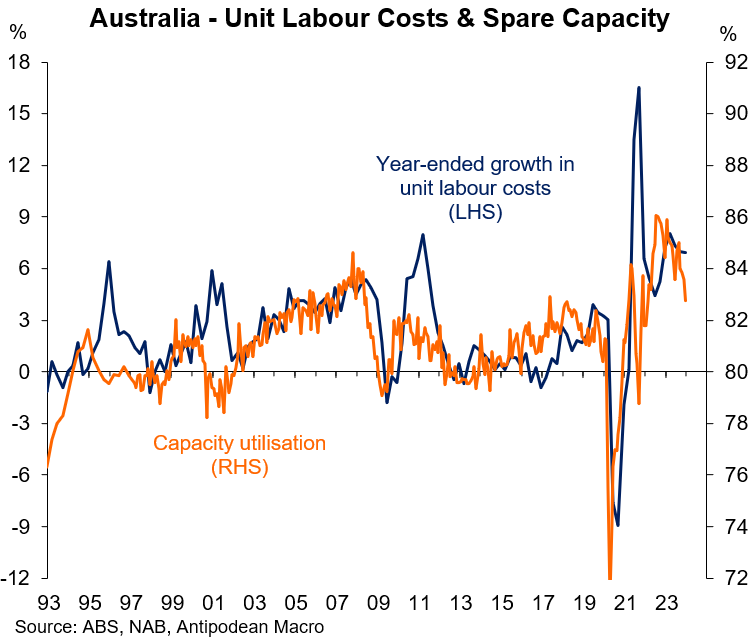
10. Unit labour costs rose +1.3% q/q and 6.6% y/y in Q4 in Australia. While quarterly growth has moderated a bit (and was +1% q/q on a non-farm basis), year-ended ULCs growth was fast relative to other economies.
While there are some signs that elevated domestic services inflation is starting to cool a little in Australia, robust growth in unit labour costs (and lags) means that it is likely to take some time to fall substantially.
Nonetheless, rising spare capacity in the Australian economy should continue to put some downward pressure on unit labour cost growth.
11. The wages share of income in Australia has risen for several quarters to be close to the long-run average.
Focusing just on the private non-mining sector, the wages share has risen strongly to be average the 30-year average.
Discussion about this post
No posts













Hi Michael, I'll put up a real GDP per capita chart with Japan in the Notes section.
Great charts but I would have like to see Japan added to the mix for comparison. It has kept interest rates low and GDP per capita doesn’t seem to have declined.
Australia and NZ are obsessed with “balancing the books”, so no surprise growth has been anemic.
https://tradingeconomics.com/japan/gdp-per-capita#:~:text=The%20GDP%20per%20Capita%20in,of%206260.68%20USD%20in%201960.