Aussie Q4 CPI: RBA undershoot
Australia’s Q4 CPI will be released on 31 January, just before the RBA Board meets on 5-6 February. The Bank will now release updated forecasts in the Statement on Monetary Policy (and provide a media conference) at the same time as the policy announcement.
Key expectations
The monthly CPI for November - which printed close to our expectations - provided key inputs to firm up ‘nowcasts’ of Q4 inflation. Our expectations are based on bottom-up estimates for all 87 CPI sub-components.
Headline CPI inflation is expected to have been +0.7% q/q and +4.2% y/y in Q4 compared with the RBA’s November SMP forecast of +4.5% y/y.
We expect trimmed mean CPI inflation to have been a little above +0.8% q/q and to round up to +4.3% y/y. This would be below the RBA’s November SMP forecast for +1.0% q/q and +4.5% y/y.
Significant increases to government-provided rent subsidies for 1.1m households from 20 September dampened Q4 CPI rents inflation and subtracted a bit less than 0.1ppts from both quarterly headline and trimmed mean inflation on our calculations. This is important for thinking about the chances for further disinflation in Q1.
In terms of risks, the unpredictability of the strength of holiday travel & accommodation prices in December is a key uncertainty to our estimates.
We have assumed a 20% m/m rise in holiday travel prices for December, but an outcome closer to the prior year’s +27% m/m gain results in nearly a 0.1ppt lift to our estimates of quarterly headline and trimmed mean inflation (all else equal).
A much weaker-than-expected outcome of +10% m/m, however, has little effect on our trimmed mean estimate even though headline inflation would be nearly 0.2ppts lower.
RBA sitting still
Our view is the RBA Board will keep the cash rate at 4.35% for a while now and until there are clear signs of labour market deterioration. Labour market conditions continue to gradually ease but the level of spare capacity remains relatively modest.
In the near-term, the Board/Bank is likely to continue pointing to (mostly) encouraging global developments on (dis)inflation but note that domestic inflation remains too high. In that vein, the latest US CPI data showed resilient services inflation (see below). The Bank will also be well aware of the temporary inflation relief in Q4 provided by government rent subsidies.
Key CPI inflation nowcasts
Imported deflation offsetting sticky, but lower, ‘domestic’ inflation
Australia’s CPI inflation towards the end of 2023 was characterised by sticky ‘domestic’ inflation but falling tradables prices.
Our expectation is that non-tradables inflation will again print around the +1.3% q/q mark (on a seasonally adjusted basis). In part this reflects sharp increases in tobacco prices in October/November following the government’s 5% excise increase in addition to the usual semi-annual indexation process (to wages growth).
Tobacco prices are expected to have risen nearly 7% q/q in Q4 and contributed almost 0.2ppts to quarterly headline CPI inflation.
Government-administered (excl. tobacco) inflation is estimated to have increased by 0.5% q/q (+1.1% seasonally adjusted) in Q4. Government electricity price subsidies introduced in July and (mostly) paid quarterly continue to dampen prices paid by a significant share of households.
Excluding tobacco, ‘core’ non-tradables inflation is expected to have moderated to ~1% q/q which would be well down from the 2%-plus quarterly peak in 2022.
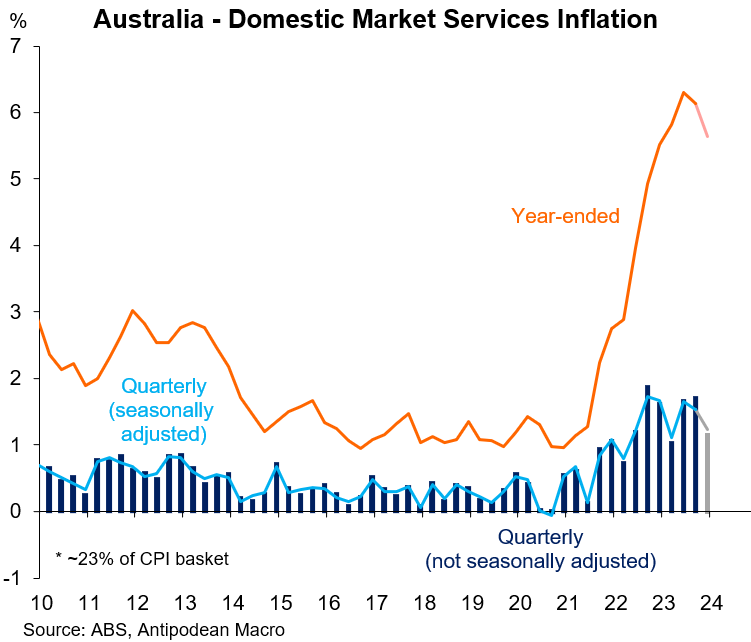
Within non-tradables inflation, all indications are that domestic market services inflation - nearly one-quarter of the CPI basket - moderated in Q4 to a bit over 1% q/q.
In part this reflects slower price increases for meals out & takeaway (+0.9% q/q) - as reflected in the monthly CPI for November - compared with the prior two quarters. In contrast, price rises for insurance remained very strong in Q4 (+3.8% q/q).
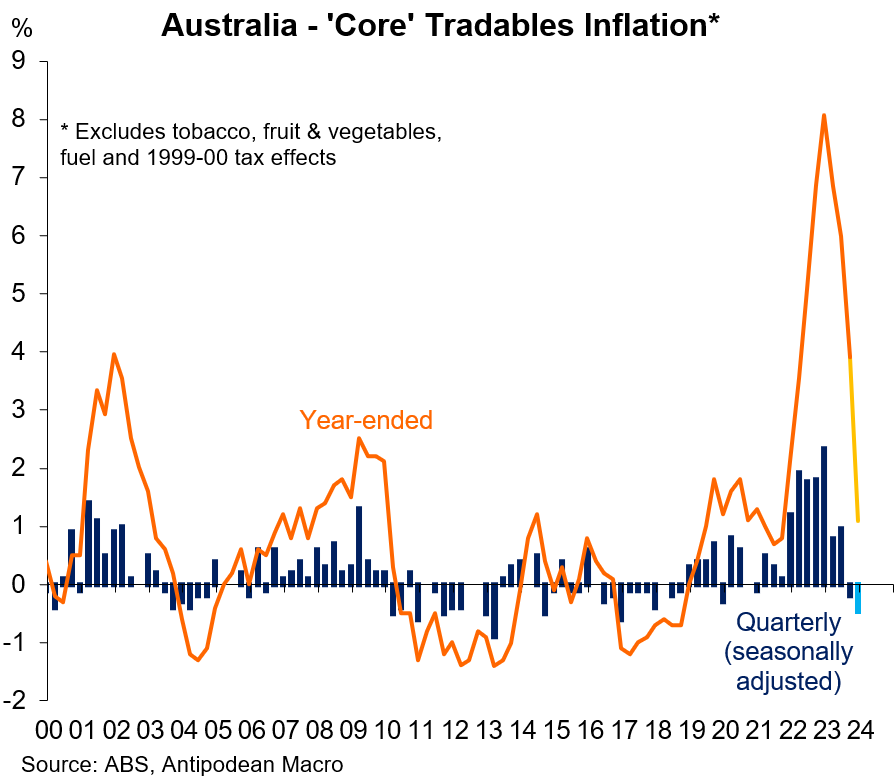
Tradable CPI categories are collectively expected to have fallen in price in Q4. Excluding ‘volatile’ items (fuel and fruit & vegetables), we estimate that ‘core’ tradables prices declined by around 0.5% q/q in the quarter. Fuel prices are expected to have increased only slightly.
Prices for consumer durables, which account for nearly half of the tradables CPI, are estimated to have fallen sharply in Q4. Prices falls are expected to have been most pronounced for household goods. This is consistent with weaker import price inflation, lower freight costs and soft goods demand.
The weakness in tradables and consumer durables inflation will be reflected in lower goods inflation overall in Q4.
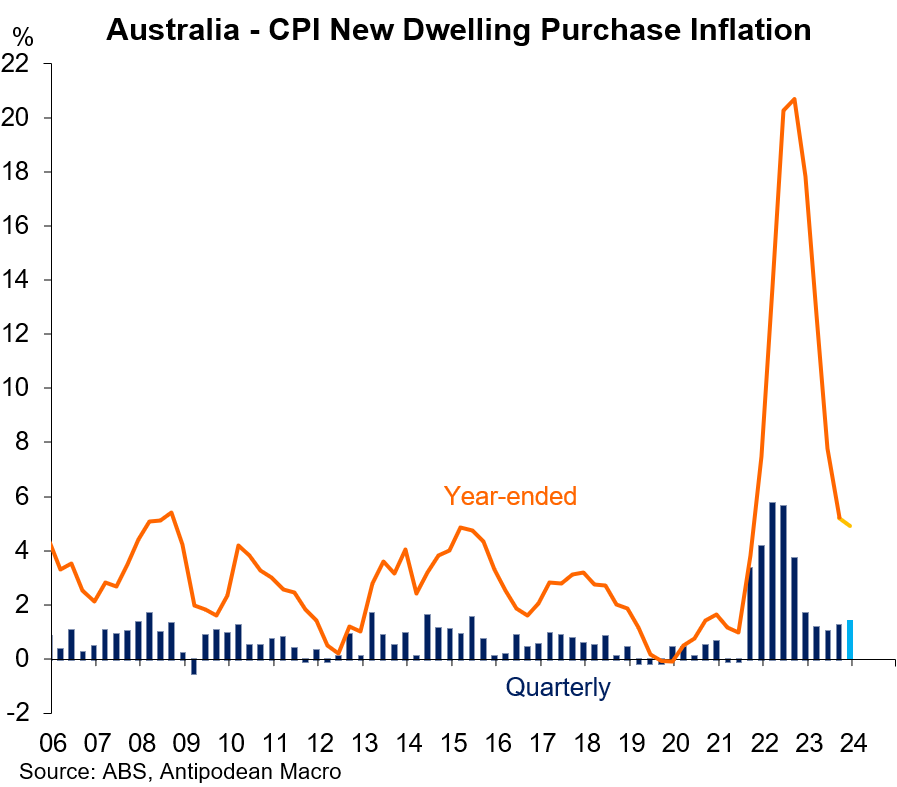
Goods inflation in Australia includes new dwelling purchase by owner-occupiers as this reflects the cost to build new homes (imputed owner’s equivalent rent is captured as a service in the US and other economies).
Monthly CPI data suggest that new dwelling purchase inflation picked up a little in Q4. It’s possible that the resurgence in established home prices last year emboldened developers to lift new home prices a little faster (and/or reduce incentives).
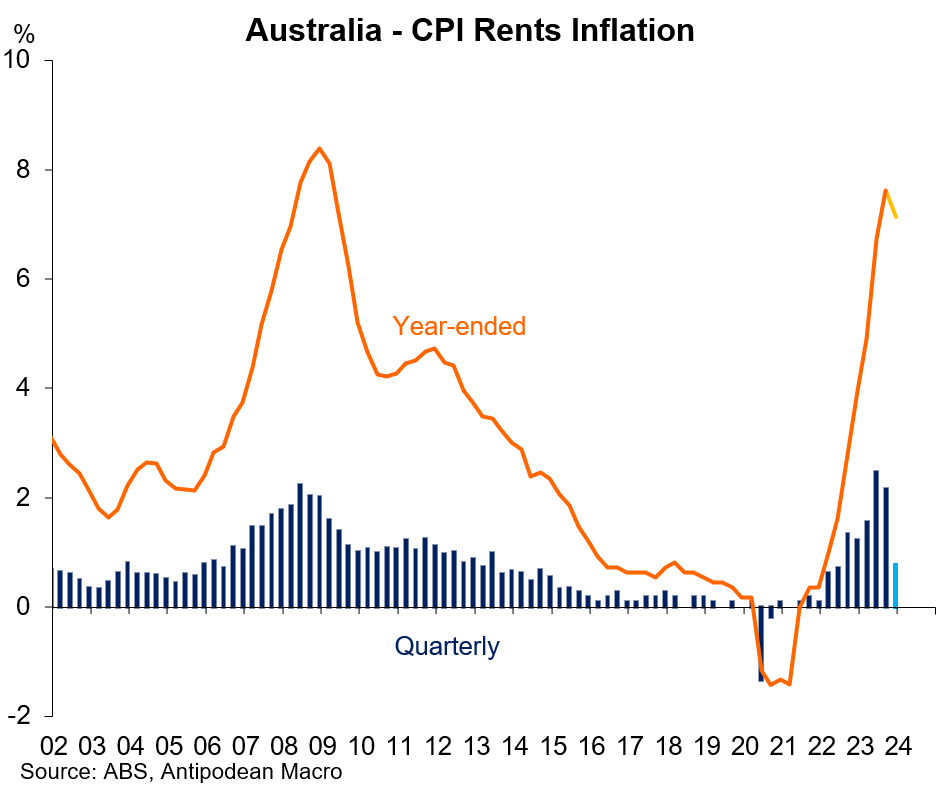
CPI rents inflation is likely to have moderated in Q4 as the Government’s additional 15% increase to Commonwealth Rent Assistance - which is treated as a subsidy in the CPI - partly offset strong underlying rent increases.
Another outcome of more than +2% q/q would have occurred without the increase to rent assistance, which would have resulted in Q4 headline and trimmed mean CPI inflation being almost 0.1ppts higher (all else equal).
Services inflation to remain elevated
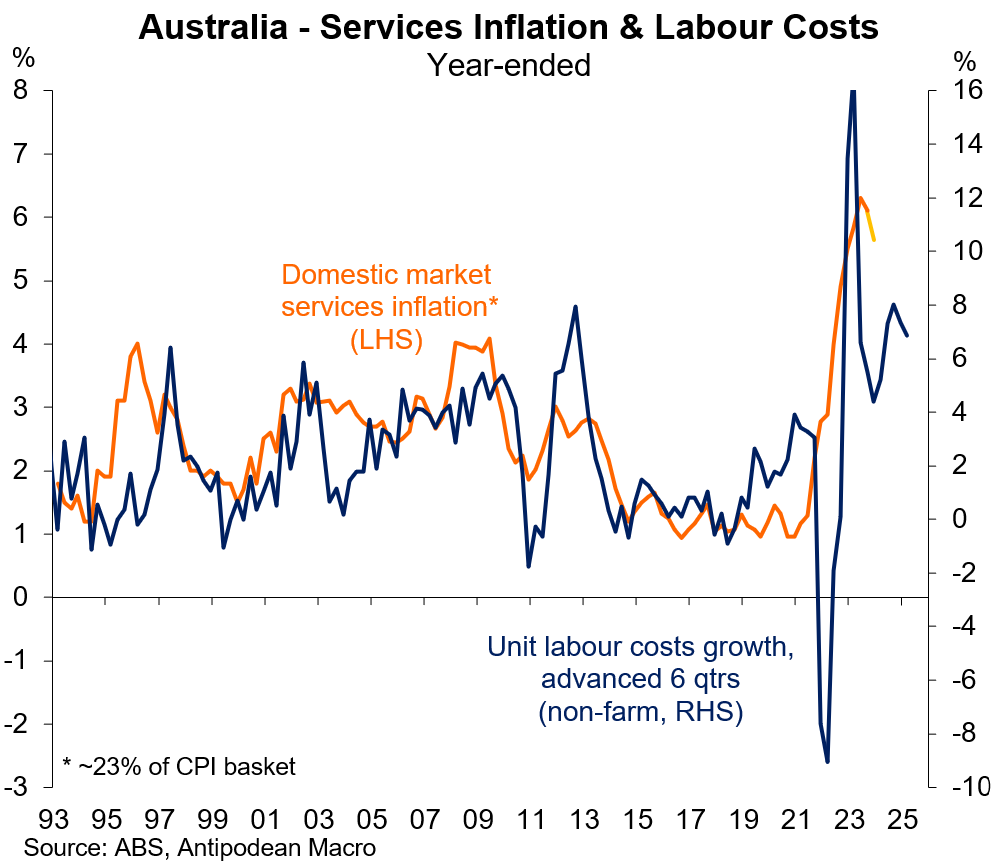
Absent an abrupt adverse economic shock, services inflation in Australia is likely to remain elevated for some time and until significant progress is made on lowering growth in unit labour costs. This is likely to require much slower growth in employment and/or wages growth.
Rents inflation is also likely to remain strong amid very low rental vacancy rates and as fast growth in new rental agreements feeds through gradually to the CPI (stock) measure.
The resilience of services inflation in the United States in recent months also points to the challenges (globally) of dampening services inflation amid very tight labour market conditions.






Hey mate - great piece, the perfect way for someone like me not currently connected to markets to keep up with what's going on with economic data.
I've got two comments/questions.
1. Both the graphs titled 'Core' Tradables Inflation and 'Core' Non-tradables Inflation have a footnote saying the series exclude tobacco. Is it that there are tradable and non-tradable types of tobacco (due to Australia's quarantine regulations etc.)?
2. The quarterly SA and NSA inflation rates on the graph titled Australia - Domestic Market Services Inflation look quite similar (and to my eye, the SA series looks to have residual seasonality. The graph might work better (=be easier to read) with just the NSA bars, but obviously worth checking the diagnostics from your seasonal adjustment program (and I appreciate there would be an inconsistency issue with your other graphs that show SA quarterly inflation.
Keep up the good work!
Cheers, Markus